


States where machinists earn the most
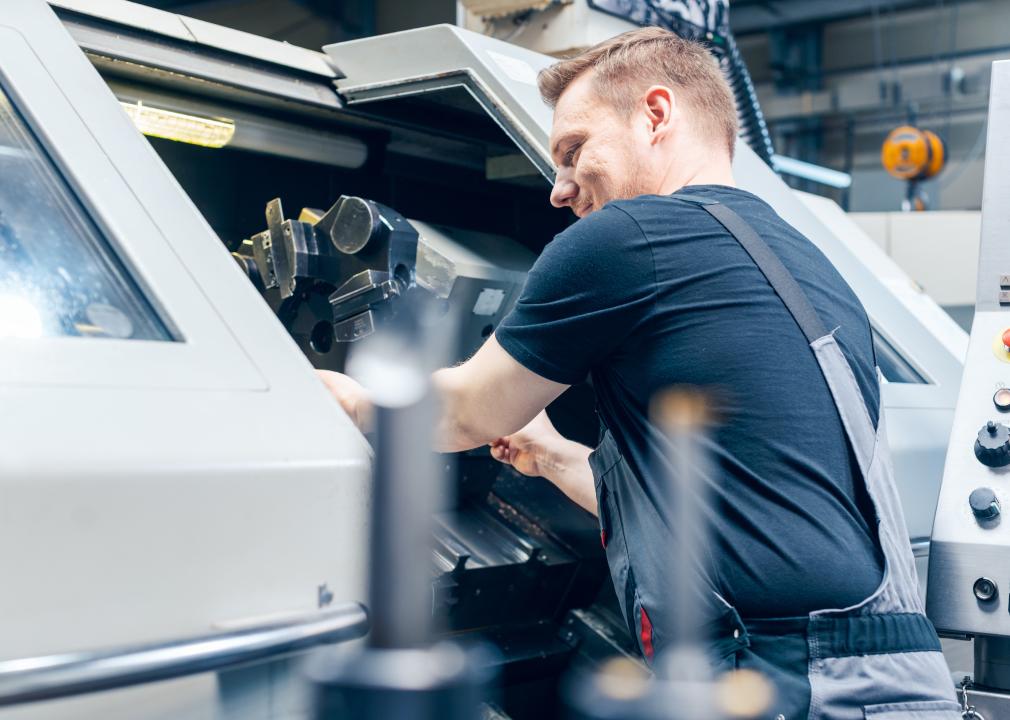
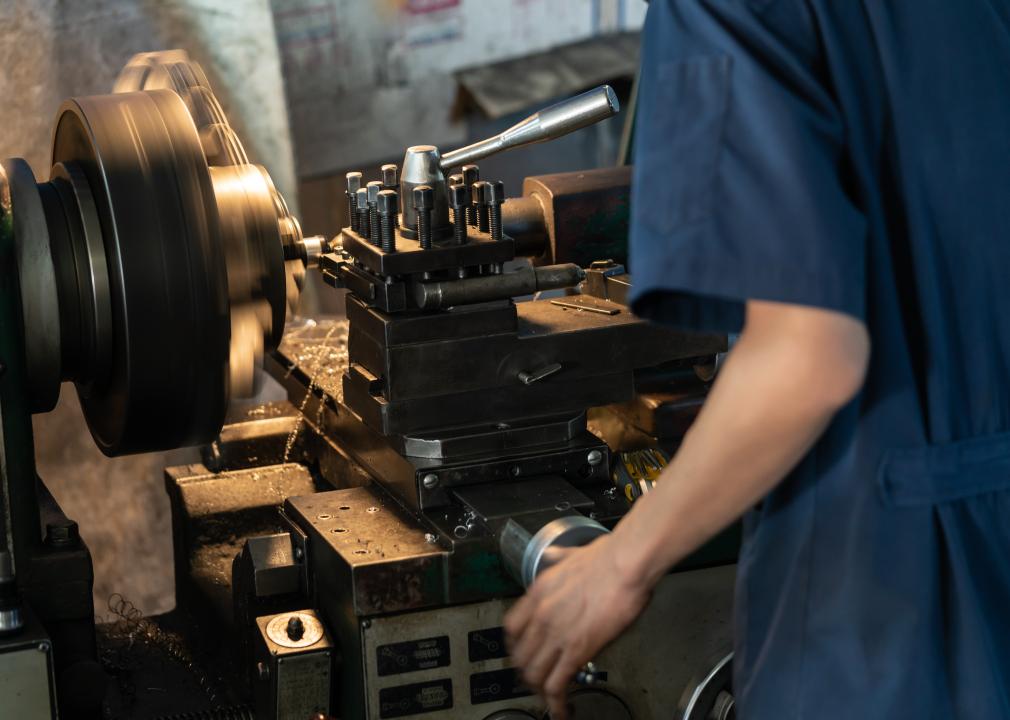
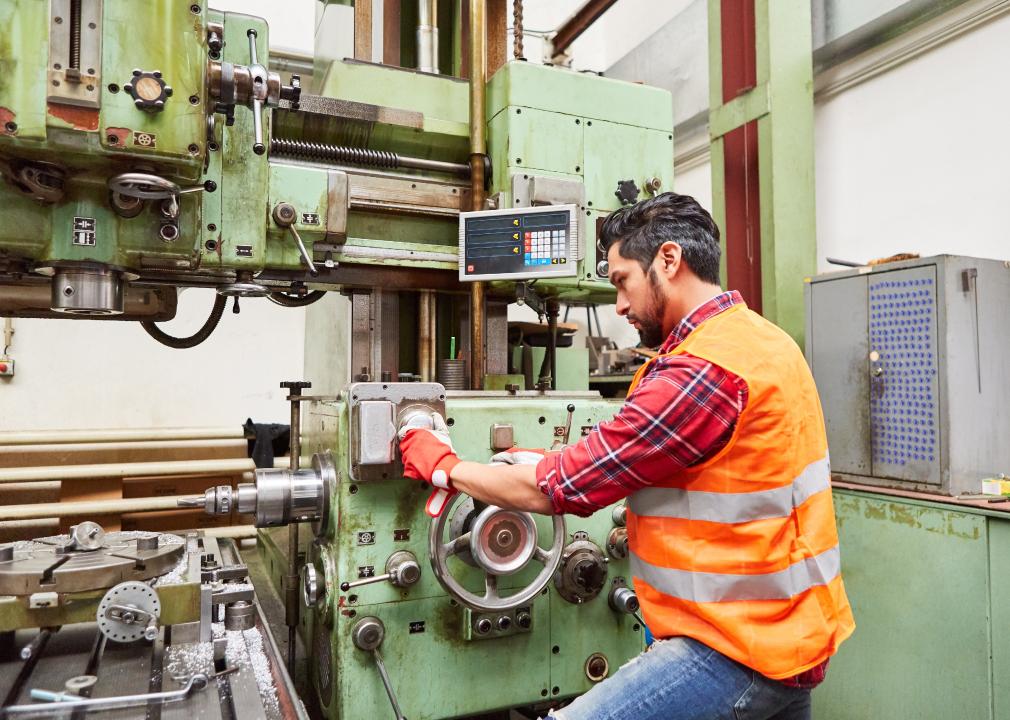
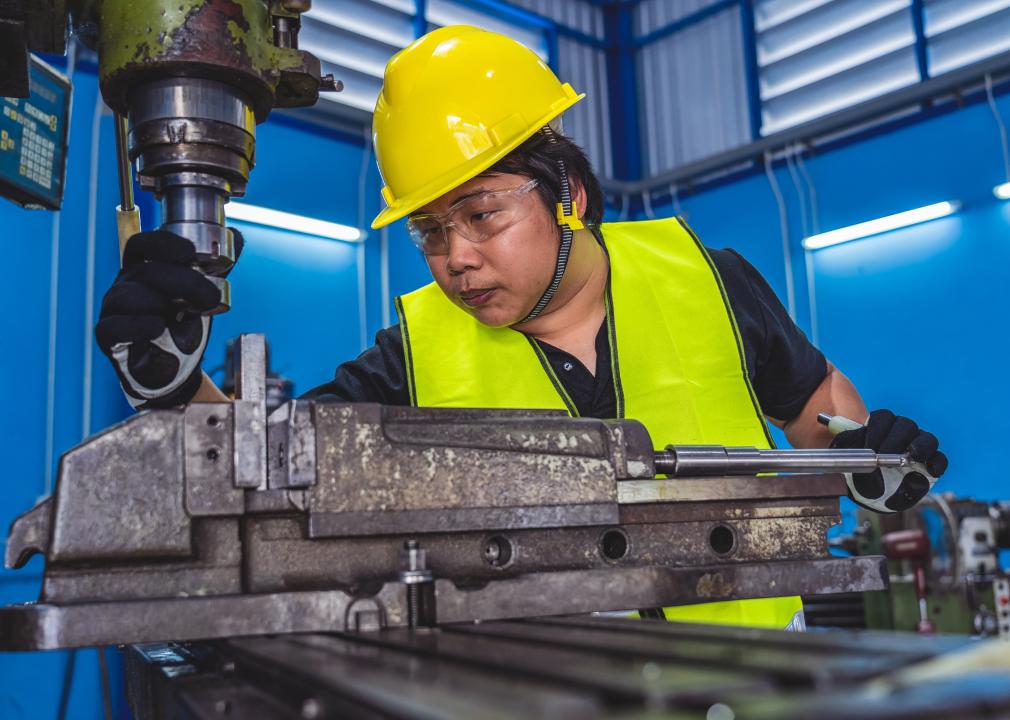
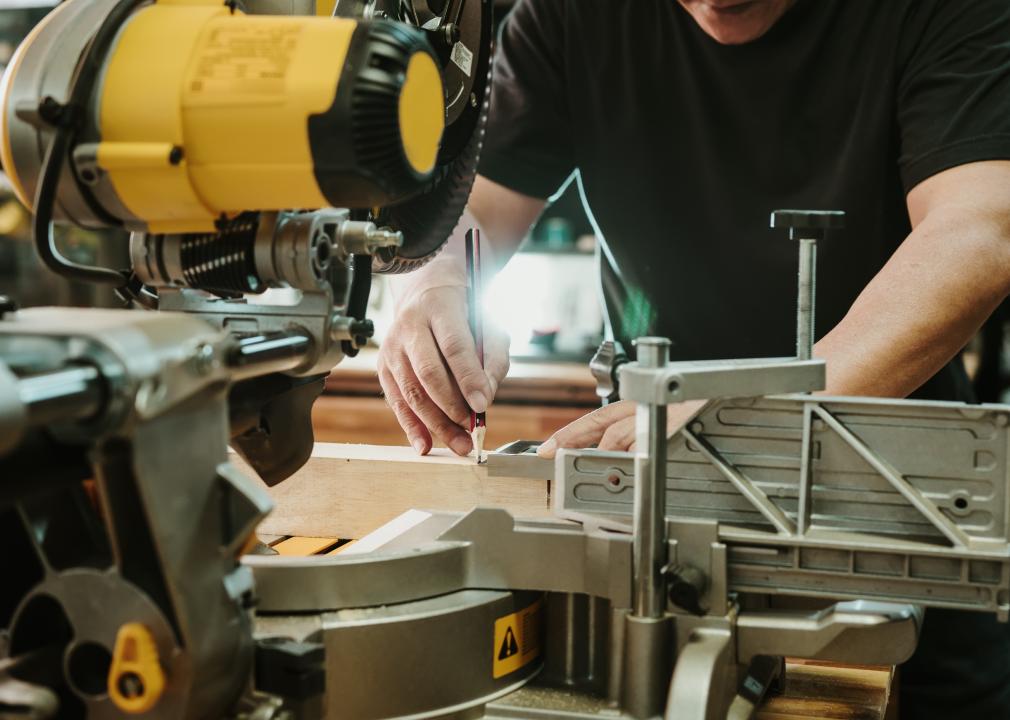
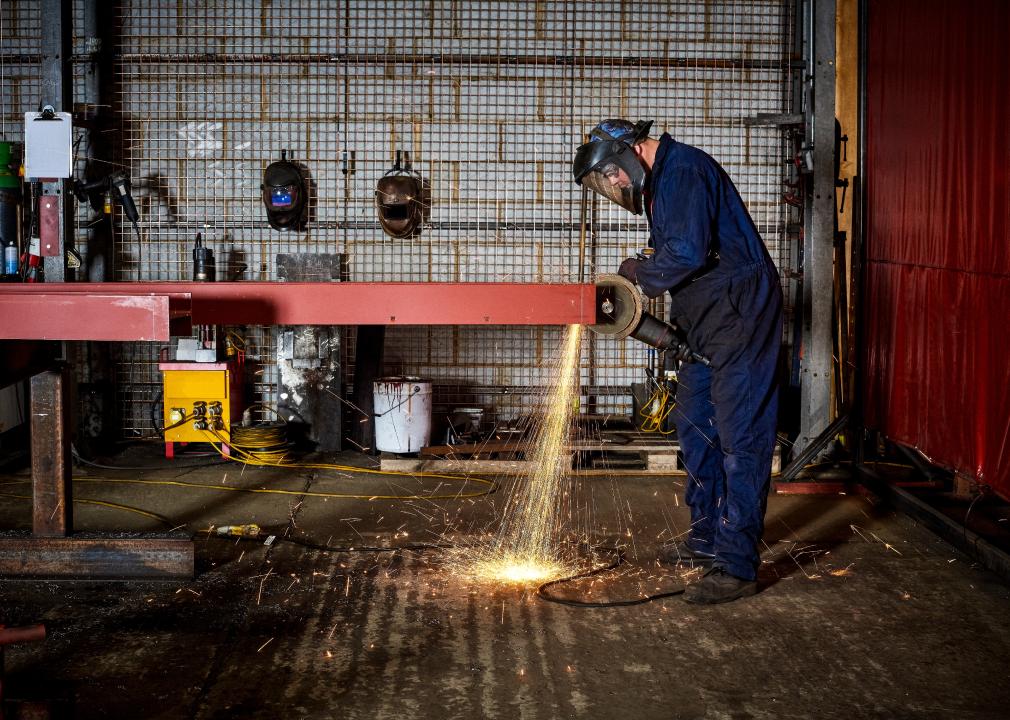
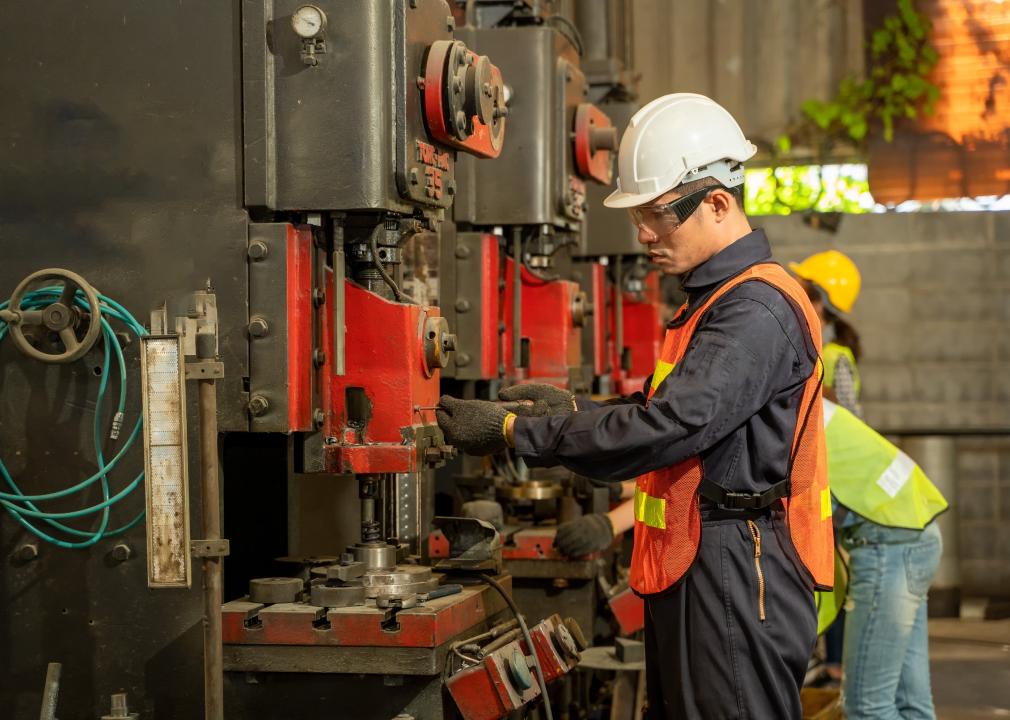
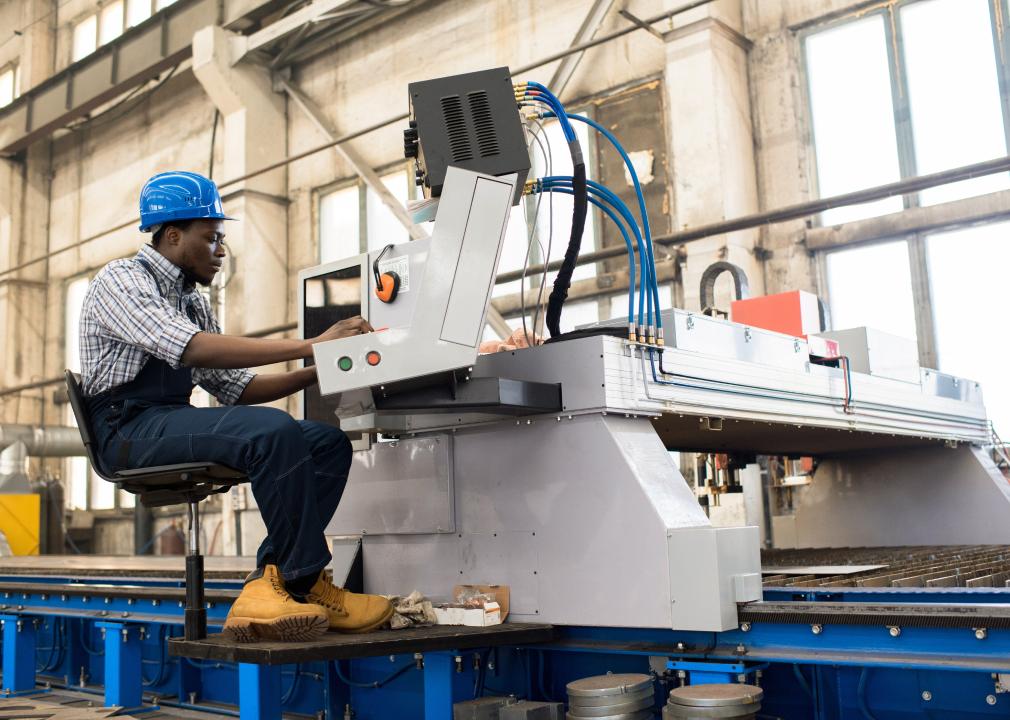
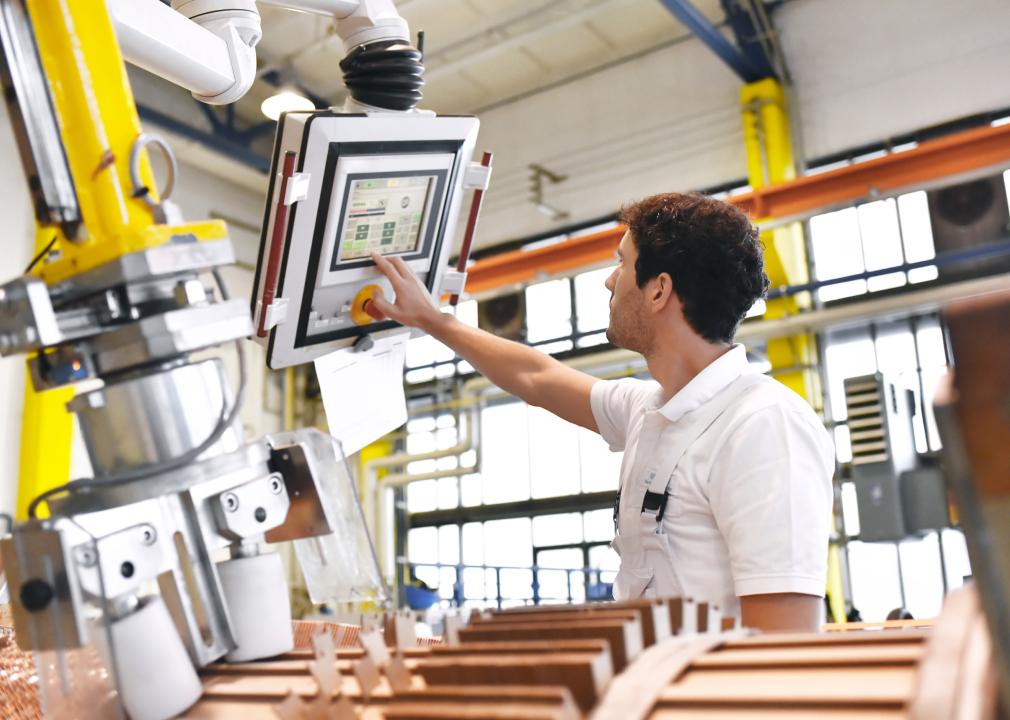
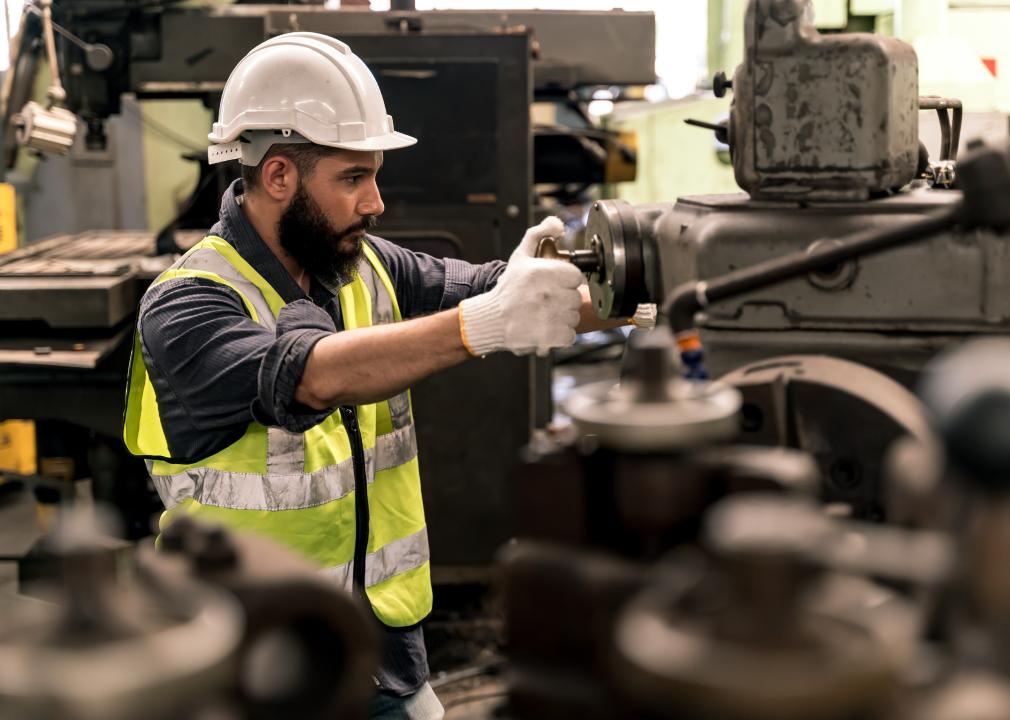
While no industry or job type is recession-proof, there are those that are recession-resistant. A career as a machinist is one that is readily attainable without the need of a four-year college diploma and it’s one that tends to stay steady even in economic downturns. It’s a job type defined by the U.S. Bureau of Labor Statistics as someone who operates machinery that produces precision metal parts, tools, and instruments, or programs or operates computer numerically controlled equipment such as lathes, routers, or laser-guided equipment.
Generally speaking, machinists needs a high school diploma and learn their craft through long-term on-the-job training and apprenticeships, often coupled with in-classroom instruction via vocational schools or community and technical colleges.
The BLS estimates that there are 333,220 machinists nationally as of May 2021, earning a mean annual salary of just over $49,000 per year. According to the U.S. Bureau of Labor Statistics (BLS), jobs for machinists are expected to grow 7% through 2030, which translates into approximately 47,500 new jobs for machinists and tool-and-die makers across multiple industries. These new openings will come about as machinists retire or move into other occupations.
Where can machinists expect to make the highest salaries? Revelation Machinery ranked the 25 states where machinists are paid the most using salary data from the Bureau of Labor Statistics. This compilation of data includes a comparison of the median machinist salary to the state median salary for all jobs and the number of machinists per 1,000 jobs in each state.
#25. Indiana (tie)
– Median salary: $37,920 (29% higher than state median salary)
– Machinists per 1,000 jobs: 6.32

#25. Nebraska (tie)
– Median salary: $37,920 (28% higher than state median salary)
– Machinists per 1,000 jobs: 3.98
#25. New York (tie)
– Median salary: $37,920 (4% higher than state median salary)
– Machinists per 1,000 jobs: 1.47

#24. California
– Median salary: $38,010 (8% higher than state median salary)
– Machinists per 1,000 jobs: 2.11

#23. Arizona
– Median salary: $38,050 (27% higher than state median salary)
– Machinists per 1,000 jobs: 1.52
#22. Idaho
– Median salary: $38,070 (33% higher than state median salary)
– Machinists per 1,000 jobs: 1.67

#21. Colorado
– Median salary: $38,100 (8% higher than state median salary)
– Machinists per 1,000 jobs: 1.67
#20. Vermont
– Median salary: $38,110 (6% higher than state median salary)
– Machinists per 1,000 jobs: 1.88
#19. Pennsylvania
– Median salary: $38,120 (29% higher than state median salary)
– Machinists per 1,000 jobs: 2.78

#18. Rhode Island
– Median salary: $38,170 (24% higher than state median salary)
– Machinists per 1,000 jobs: 2.93

#17. Connecticut
– Median salary: $38,810 (9% higher than state median salary)
– Machinists per 1,000 jobs: 5.81
#16. New Hampshire
– Median salary: $38,870 (26% higher than state median salary)
– Machinists per 1,000 jobs: 3.14
#15. Virginia
– Median salary: $39,100 (31% higher than state median salary)
– Machinists per 1,000 jobs: estimate not available

#14. Oregon
– Median salary: $39,690 (21% higher than state median salary)
– Machinists per 1,000 jobs: 1.97

#13. Minnesota
– Median salary: $40,580 (19% higher than state median salary)
– Machinists per 1,000 jobs: 3.85

#12. North Dakota
– Median salary: $42,010 (35% higher than state median salary)
– Machinists per 1,000 jobs: 0.87

#11. Utah
– Median salary: $43,550 (47% higher than state median salary)
– Machinists per 1,000 jobs: 2.06

#10. Louisiana
– Median salary: $44,260 (85% higher than state median salary)
– Machinists per 1,000 jobs: 2.61

#9. New Jersey
– Median salary: $45,540 (38% higher than state median salary)
– Machinists per 1,000 jobs: 1.13

#8. Maine
– Median salary: $46,110 (52% higher than state median salary)
– Machinists per 1,000 jobs: 2.23
#7. Delaware
– Median salary: $46,710 (56% higher than state median salary)
– Machinists per 1,000 jobs: 0.75

#6. Alaska
– Median salary: $46,910 (28% higher than state median salary)
– Machinists per 1,000 jobs: 0.52

#5. Massachusetts
– Median salary: $47,660 (28% higher than state median salary)
– Machinists per 1,000 jobs: 2.53
#3. Maryland (tie)
– Median salary: $47,940 (47% higher than state median salary)
– Machinists per 1,000 jobs: 0.88

#3. Washington (tie)
– Median salary: $47,940 (29% higher than state median salary)
– Machinists per 1,000 jobs: 2.70

#2. Hawaii
– Median salary: $59,630 (76% higher than state median salary)
– Machinists per 1,000 jobs: 0.48
#1. Washington D.C.
– Median salary: $76,240 (56% higher than state median salary)
– Machinists per 1,000 jobs: 0.12